
Football analysis runs on per-season numbers. Conversion rate, shot accuracy, dribble success, duels won. People quote them as if they tell you who a player is.
Some do. Most of them just tell you what kind of season he had.
Corrected on 25 September 2026. Figures updated after a data fix; the conclusions are unchanged. Details at the end.
We wanted to know which is which, so we tested them one at a time. The method's simple enough to explain in four steps.
- Rank every Premier League player on a stat. Passes per game, say.
- Split the list down the middle into a top half and a bottom half.
- Measure how far apart the two halves are.
- Wait a year, find the same players, and measure the gap between the same two groups again.
If the gap's still there, the stat was telling you something about the players. If it's closed up, it was telling you about the season they happened to have.
We call what's left the retention. A stat that keeps 82% of its gap is picking up something that lasts. One that keeps 12% has watched its two groups more or less merge.
Compare like with like
Put a striker next to a centre-back and of course the striker takes more shots. He'll take more next year too. That doesn't make shots a reliable stat, it just means the centre-back is still a centre-back.
So every comparison here is made within a position group: forwards against forwards, defenders against defenders. It matters more than you'd think. Lump everyone together and shots per 90 looks 87% reliable. Do it properly and it's 62%. Most of that difference was positions, not persistence.
The detail. Four completed Premier League seasons, 2022/23 to 2025/26, which gives three season-to-season comparisons. Every outfielder with 600 or more minutes in both seasons of a comparison: 666 players, 657 season-pairs. Split at the median, measured within position, then weighted back together.
What a player does carries over. How well he does it mostly doesn't.
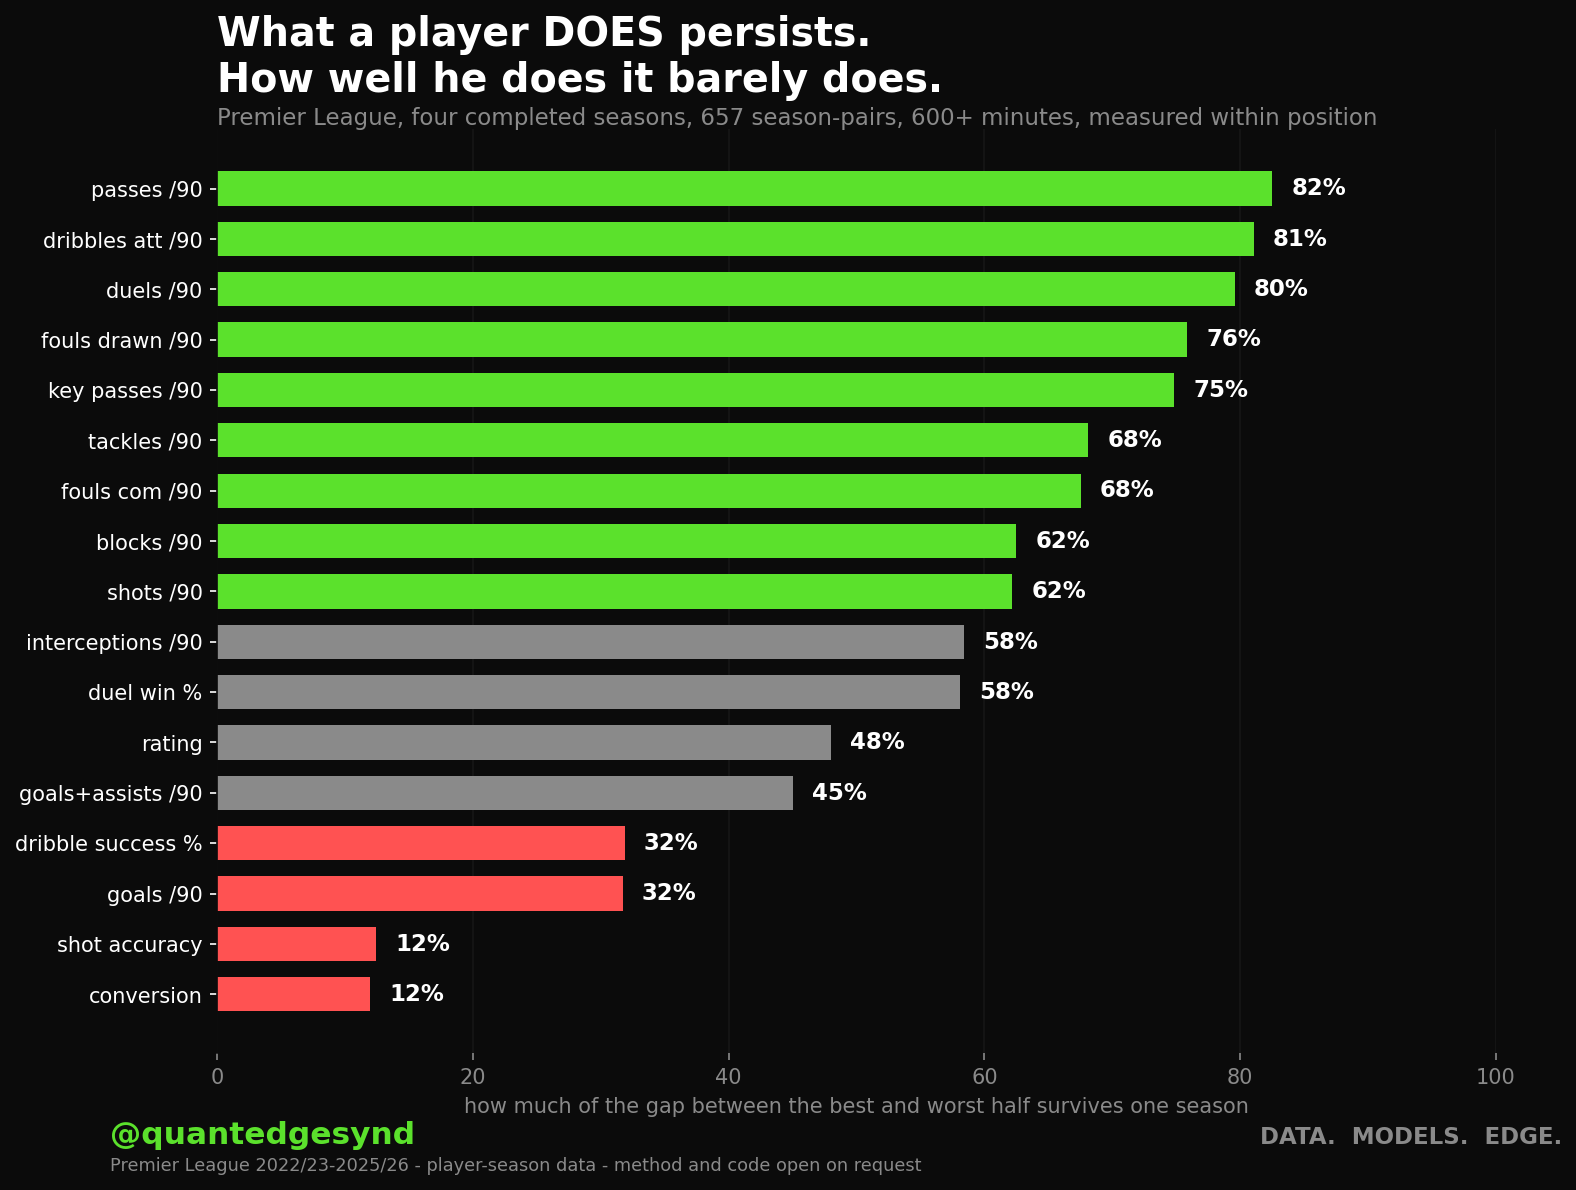
Careful with the word. Retention is one specific thing: the gap between two groups this year, divided by the gap between the same two groups last year.
It isn't a correlation, and it isn't the share of variance explained. It isn't a measure of how much of a stat is skill either. “Only 12% of finishing persists” sounds like a skill measurement, but it isn't one.
We show correlation separately, in its own column, because it answers a different question. Retention asks whether the gap is still there. Correlation asks whether the same players are still ahead. For conversion they come out at 12% and 0.10, which is close enough to be confusing and is pure coincidence.
The table
| Metric | Retained | Correlation |
|---|---|---|
| passes per 90 | 82% | 0.88 |
| dribbles attempted per 90 | 81% | 0.89 |
| duels per 90 | 80% | 0.82 |
| fouls drawn per 90 | 76% | 0.81 |
| key passes per 90 | 75% | 0.80 |
| tackles per 90 | 68% | 0.76 |
| fouls committed per 90 | 68% | 0.69 |
| shots per 90 | 62% | 0.84 |
| blocks per 90 | 62% | 0.73 |
| interceptions per 90 | 58% | 0.71 |
| duel win % | 58% | 0.75 |
| match rating | 48% | 0.50 |
| goals + assists per 90 | 45% | 0.72 |
| goals per 90 | 32% | 0.73 |
| dribble success % | 32% | 0.21 |
| shot accuracy | 12% | 0.19 |
| conversion | 12% | 0.10 |
The top of the table: what a player does
Everything near the top counts how often something happens. A player who tried a lot of dribbles this season tends to try a lot next season too. The correlation there is 0.89, the highest on the board. Passing volume, duels, key passes and tackles all keep 68% of their gap or more.
These are habits. They reflect how someone plays and what his manager wants from him, and neither changes much in twelve months.
The bottom of the table: how well he does it
Everything near the bottom is a success rate, and success rates fall apart. Shot accuracy keeps 12% of its gap. Dribble success keeps 32%. Conversion (goals per shot on target) keeps 12%, with a year-on-year correlation of 0.10.
That 12% helps our case more than it should. It covers every outfielder, centre-backs included, and a finishing rate means little for a centre-back. Look at attackers only and it rises to 25%, on 159 season-pairs. That's still well below every volume stat on the board, but if you're asking about forwards, 25% is the figure to use, not 12%.
What that looks like with real players
Take Premier League attackers and split them on finishing alone, good half and poor half, across 104 consecutive season-pairs.
In year one the good half converted 45.6% of their shots on target and the poor half 26.8%. A year later the good half had dropped to 36.6% and the poor half had climbed to 33.8%. They finished either side of the league median of 34.6%, about three points apart.
Nobody switched clubs to cause that, and nobody changed as a player. Both groups just drifted back towards the middle, which is what happens to numbers that were partly luck in the first place.
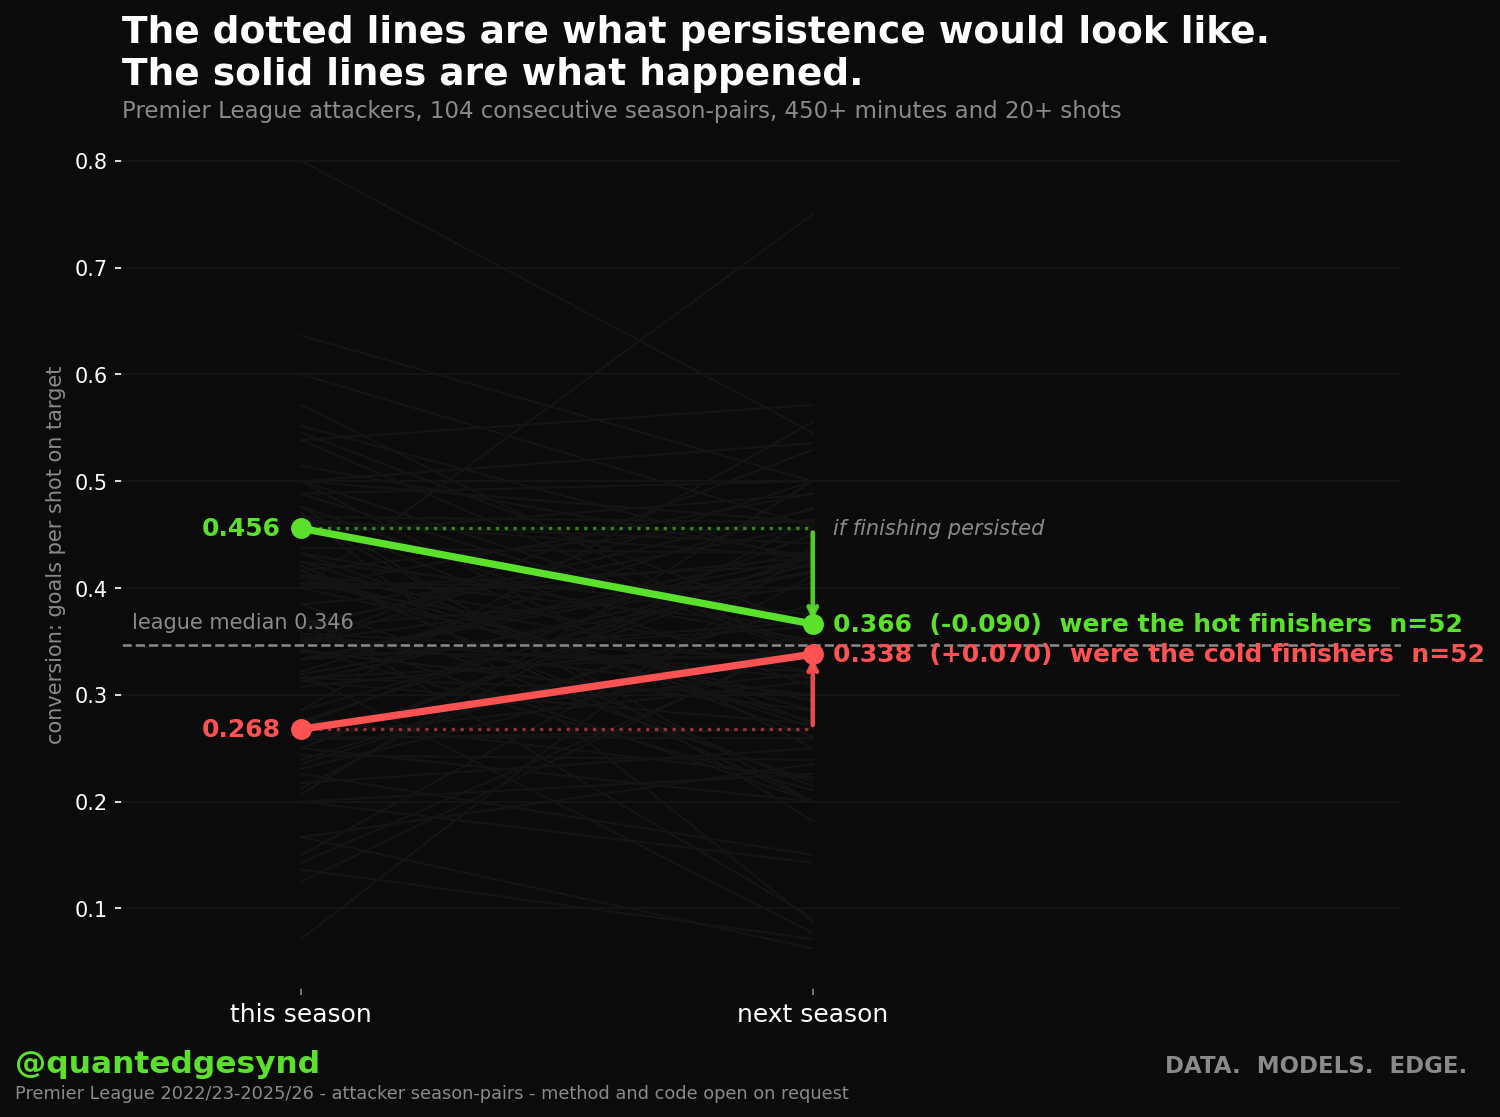
An 18.8-point gap shrank to 2.8 points, so more than four fifths of it went inside a year. The 95% interval on that change runs from −20.5 to −11.4 points. That's nowhere near zero, so we're not reading patterns into noise.
One player, both halves
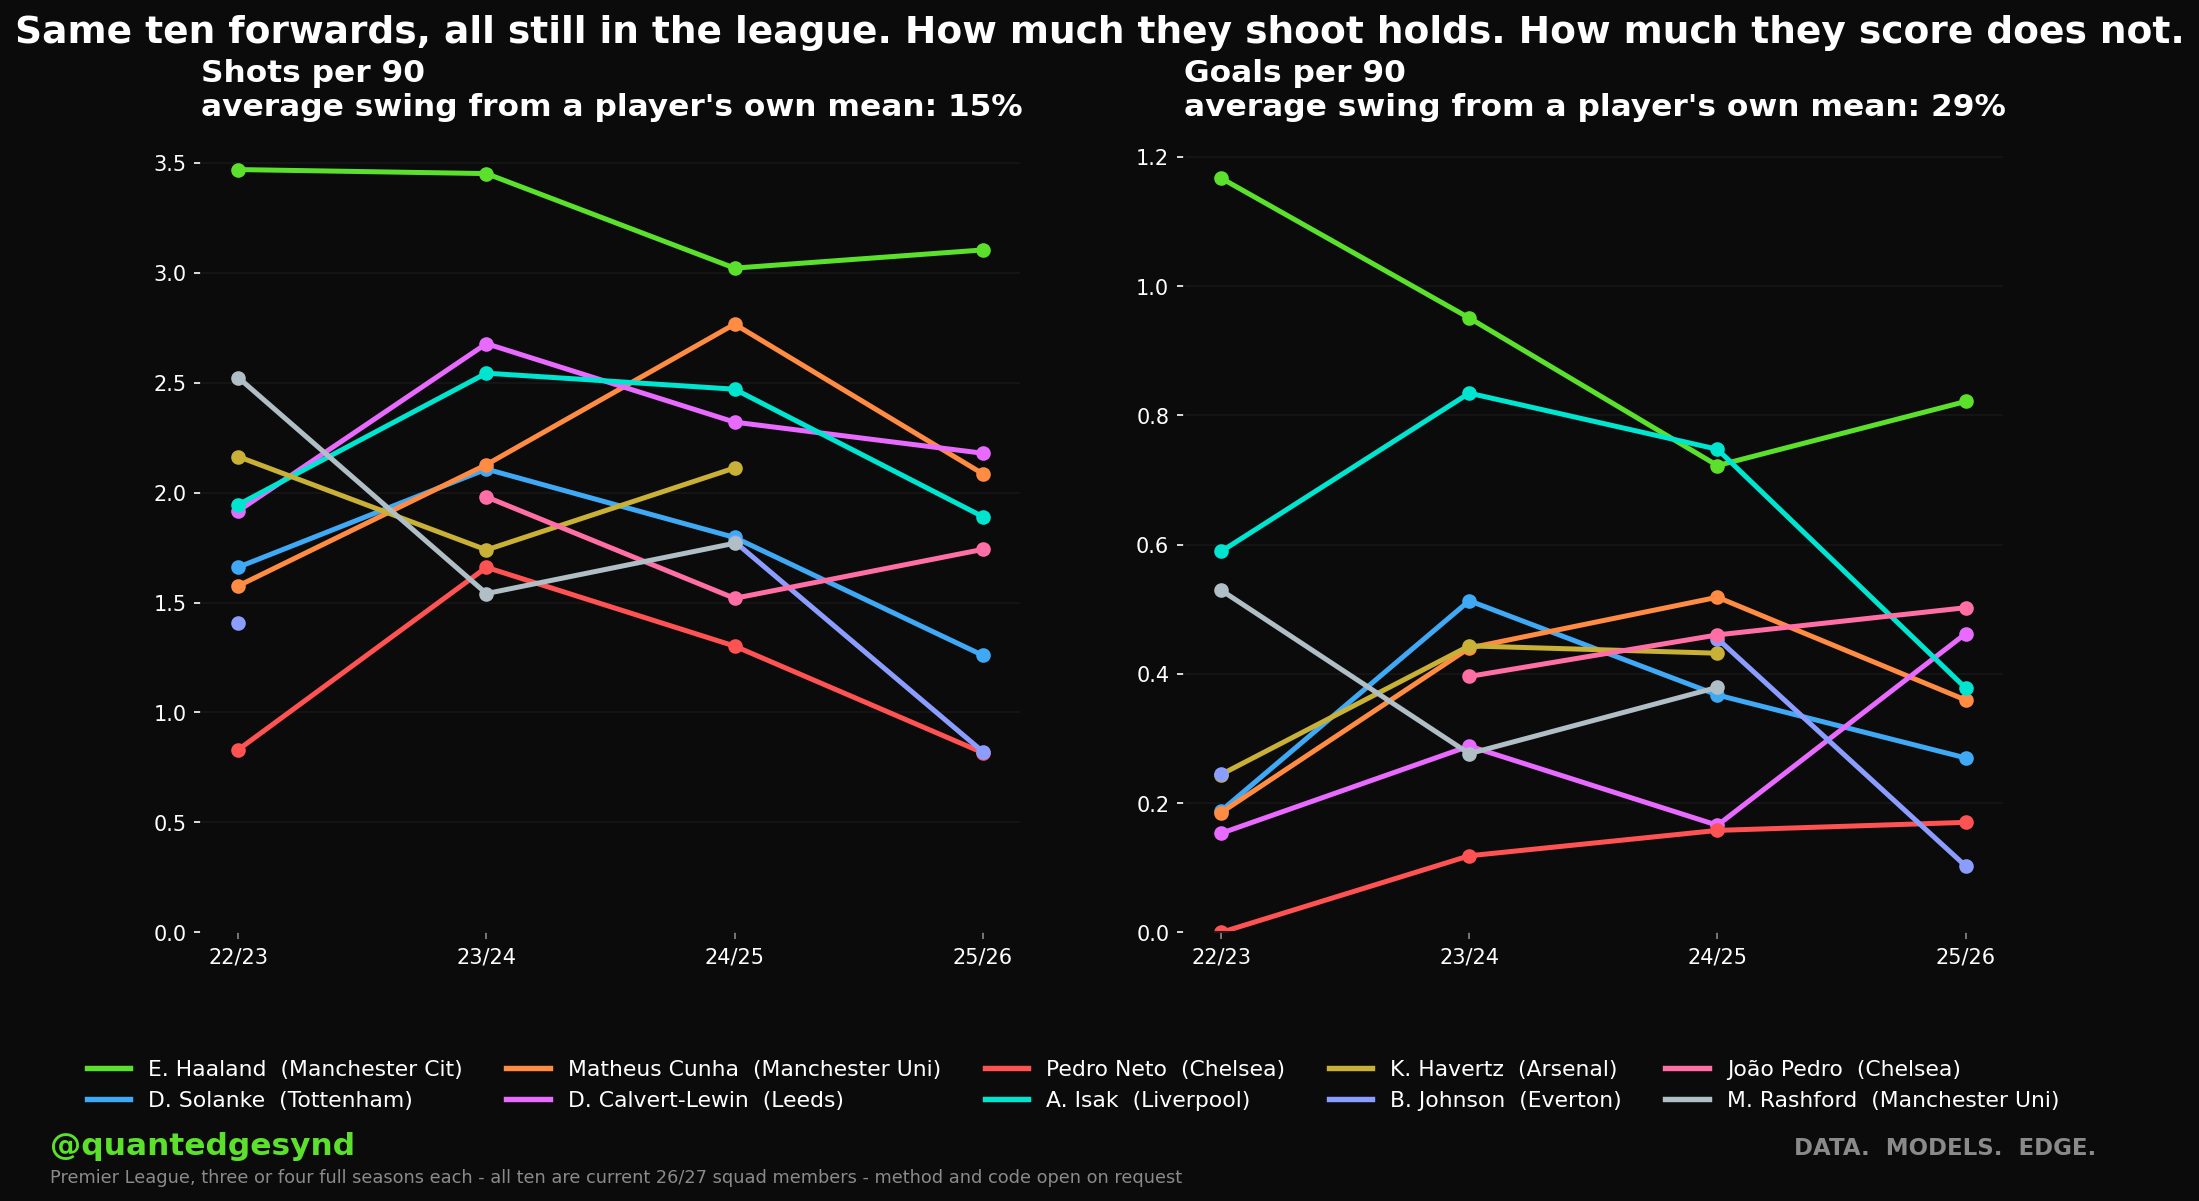
Erling Haaland shows the split better than any chart, because the two halves of his game behave so differently.
How often he shoots hardly moves. Across four seasons it's 3.47, 3.45, 3.02 and 3.10 shots per 90. That's roughly double a typical Premier League attacker, and even his quietest year is about 80% above that.
How often those shots go in swings all over the place. 60%, then 46%, then 37%, then 46% of his shots on target.
His goal rate fell by nearly 40% between 2022/23 and 2024/25, from 1.17 per 90 to 0.72, while his shooting barely changed. Nothing about how he plays broke. The bit that moved was the bit that was never steady to begin with.
Finishing isn't a myth
Over a whole career some players are clearly better finishers than others. The claim is narrower: one season of conversion rate tells you very little about the next.
Some of this drop is baked in by arithmetic rather than football, too. Every measurement has noise in it. Take the top half of a noisy measure and you've partly picked out the players who got lucky, and luck doesn't repeat. So the top half always falls back a bit, for every stat, even a perfectly good one.
That's why it's the ranking that matters here, not the individual percentages. Every stat in the table faces the same headwind. Passing volume still keeps 82% of its gap. Conversion keeps 12%. The distance between those two is real, even if both are flattered by the same arithmetic.
It's also one league, four seasons and public season totals, with no event or tracking data. The feed files centre-backs and full-backs together as "Defender", which limits what we can say about individual positions.
What this might mean for recruitment
We're not claiming this makes anyone's recruitment better. We haven't tested it against real signings and how they turned out, and until someone does, that claim hasn't been earned.
What we can say is smaller. If a screen ranks forwards on conversion rate, most of what separates the top of the list from the bottom won't be there next season. Shot accuracy, at 12%, is the same story. The stats that last are the boring ones: how often he shoots rather than how often he scores, and how often he takes a man on rather than how often it comes off.
How much that matters depends on the weight those numbers carry in your process. We can't see that from here. If you rank players for a living, we'd like to hear whether this is relevant to how you work, and whether the method holds up on better data than ours.
Reproduction
Every number here comes from our own code, run on a per-season player panel (sources below). The method, filters and code are available on request, including the parts that didn't work.
We publish the flops too. Show only the wins and you'd have no reason to believe any of it.
Data sources
- API-Football: per-season player statistics for league football (minutes, shots, shots on target, goals, assists, key passes, passes, dribbles, duels, tackles, fouls, blocks, interceptions, match rating) and the position label. Premier League, 2022/23 to 2025/26.
Corrected on 22 September 2026. Our data provider files strikers under two labels, "Attacker" and "Forward", and the original analysis only counted the first, so some forwards were left out of the within-position comparisons. With both counted, most figures moved by one or two points (conversion 11% to 12%, shots per 90 64% to 65%) and the charts were redrawn. A few neighbouring rows swapped places, but the split between volume and efficiency, and every conclusion, are unchanged. The forwards-only finishing figure is 23% on 157 season-pairs, counted by the first season's label as the table is. The finishing example now covers 103 season-pairs rather than 92, and one player changed in the ten-forwards chart.
Corrected on 25 September 2026. When a player split a season between two clubs, we had dropped the shorter spell if it was under 600 minutes, and left out players whose two spells only reached 600 together. Counting the whole season adds five season-pairs (657, from 666 players). Most retention figures moved by one to three points: passes 84% to 82%, dribbles 83% to 81%, shots 65% to 62%. The attackers-only finishing figure is now 25% on 159 season-pairs (was 23% on 157), and the finishing example covers 104 season-pairs. Volume still persists and efficiency still doesn't; the charts were redrawn.