
One projected number suggests a precision football just doesn’t have.
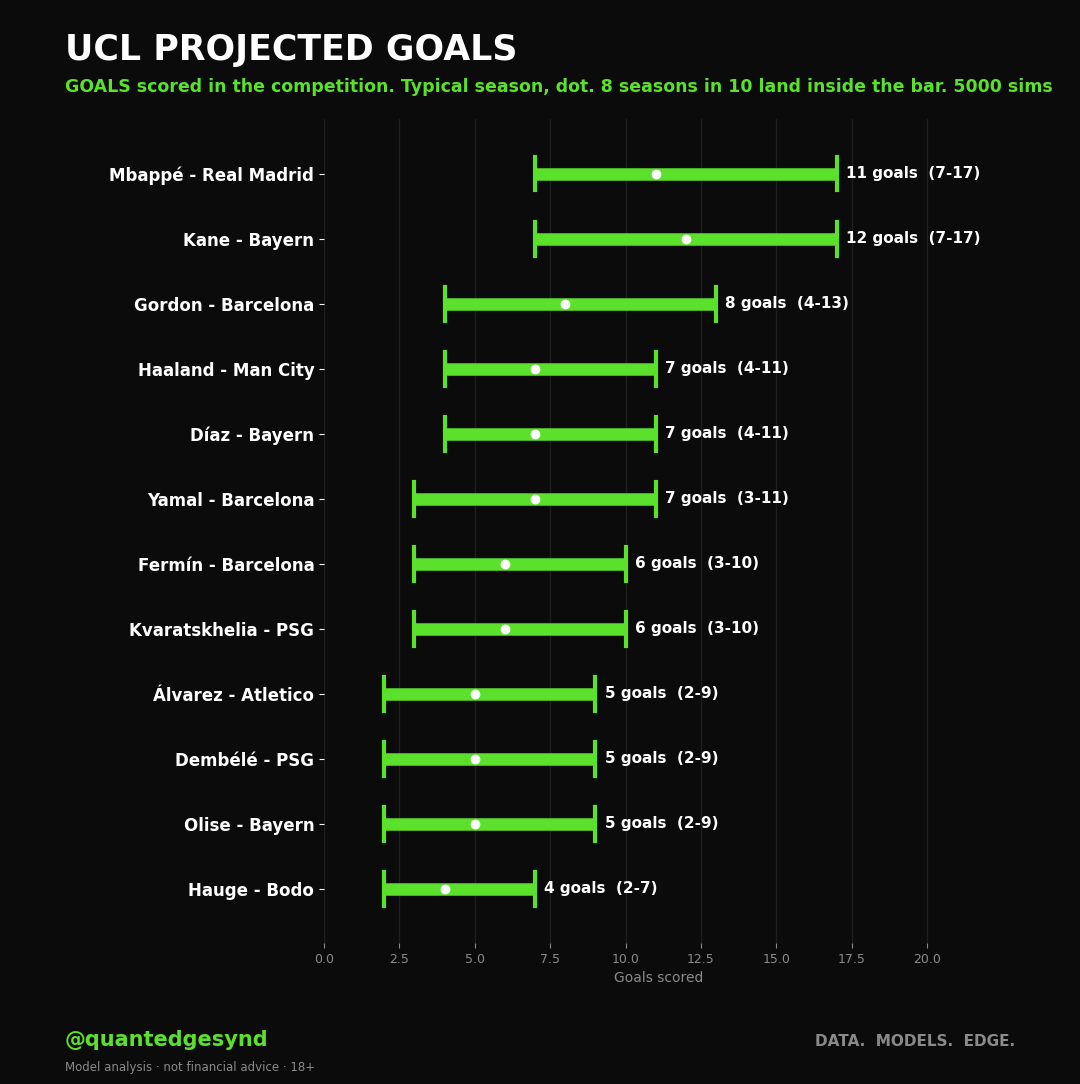
Play the season thousands of times and Mbappé averages about
11 goals, but one season in ten he finishes on 7 and one in
ten on 17. Same player, same ability. The spread comes from how far his team
gets, plus the bounce of the ball.
It’s also why the projected leader isn’t always the top scorer. A good season for Haaland (11) beats a quiet one for Mbappé (7), so Haaland outscoring him wouldn’t be an upset. Finishing top still means beating everyone, not just one rival, and that’s a separate question.
The rates only count league-phase football. We’ve left out qualifying rounds, because six goals against qualifying opposition isn’t the same as six against the last sixteen. It’s a read on how the competition is shaped, nothing more.
It’s also why the projected leader isn’t always the top scorer. A good season for Haaland (11) beats a quiet one for Mbappé (7), so Haaland outscoring him wouldn’t be an upset. Finishing top still means beating everyone, not just one rival, and that’s a separate question.
The rates only count league-phase football. We’ve left out qualifying rounds, because six goals against qualifying opposition isn’t the same as six against the last sixteen. It’s a read on how the competition is shaped, nothing more.
Data sources: player statistics, squads and fixtures from API-Football. The simulation is ours.