
You have a list of stats you use to judge players. We test which of them still describe the same player a year later.
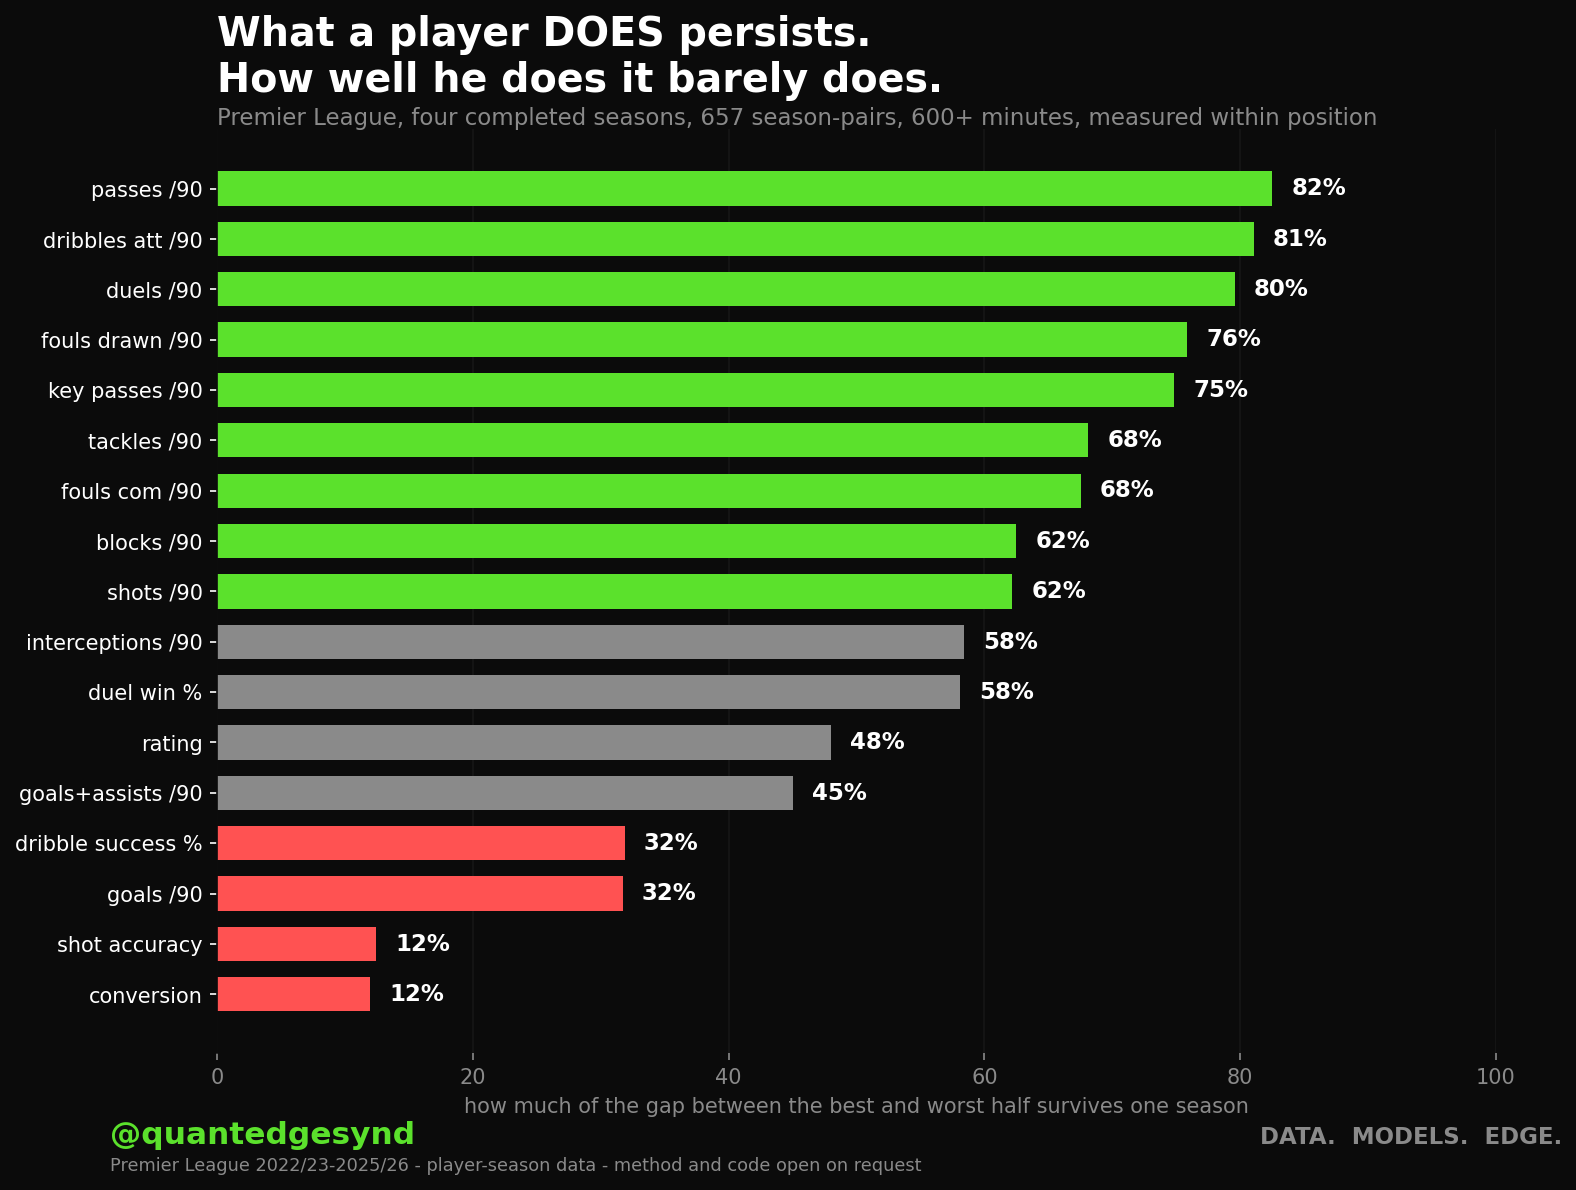
Split your players at the median on a metric, then look a season later at how far apart those same two halves still are. On four completed seasons of Premier League data, passing volume keeps 84% of that gap. Conversion rate keeps 12%. If a shortlist weights those the same way, most of what it is measuring is last season's luck.
How it works
Send us an export, or run our script yourself and send the output. You get back a ranked table of your metrics with sample sizes and intervals, and a short read on what we would change about how you weight them.
What you are actually paying for
Not the script. That is published and you are welcome to it. It is about a hundred lines and anyone competent can rebuild it in an afternoon.
You are paying for the five things that flip the answer, which we found the slow way:
Three ways in
1. The baseline
Our Premier League numbers as a comparison set, plus the method. Your result means little on its own and a lot against a reference.
2. The audit
We run it on your data and hand back:
- every metric you screen on, ranked by how much it persists
- sample sizes and intervals on each
- which of the five traps above your data has
- a two-page read on what to reweight
3. The screen
Not the metrics, the whole process. Every threshold in your recruitment screen with its evidence, its sample size, the date it was measured, and an honest verdict on whether it can be defended.
We did this to ourselves first. Three of our own rules did not survive it.
What we do not sell: player recommendations. If you hold event or tracking data, you have better inputs than we do and we would lose that comparison every time. We are not here to pick your players. We are here to check what you are picking them on.
Why trust any of it
We published this research, the sample grew, one of our readings changed, and we said so in public. That is the only evidence available that the numbers were not chosen after the fact.
Method, filters and code are open on request, including the parts that did not work.