
It depends which way he goes. Stepping up costs shots. Moving across makes no clear difference.
Corrected on 25 September 2026. Figures updated after a data fix. One reading changed: the small rise for players dropping down a division now just clears zero. Details at the end.
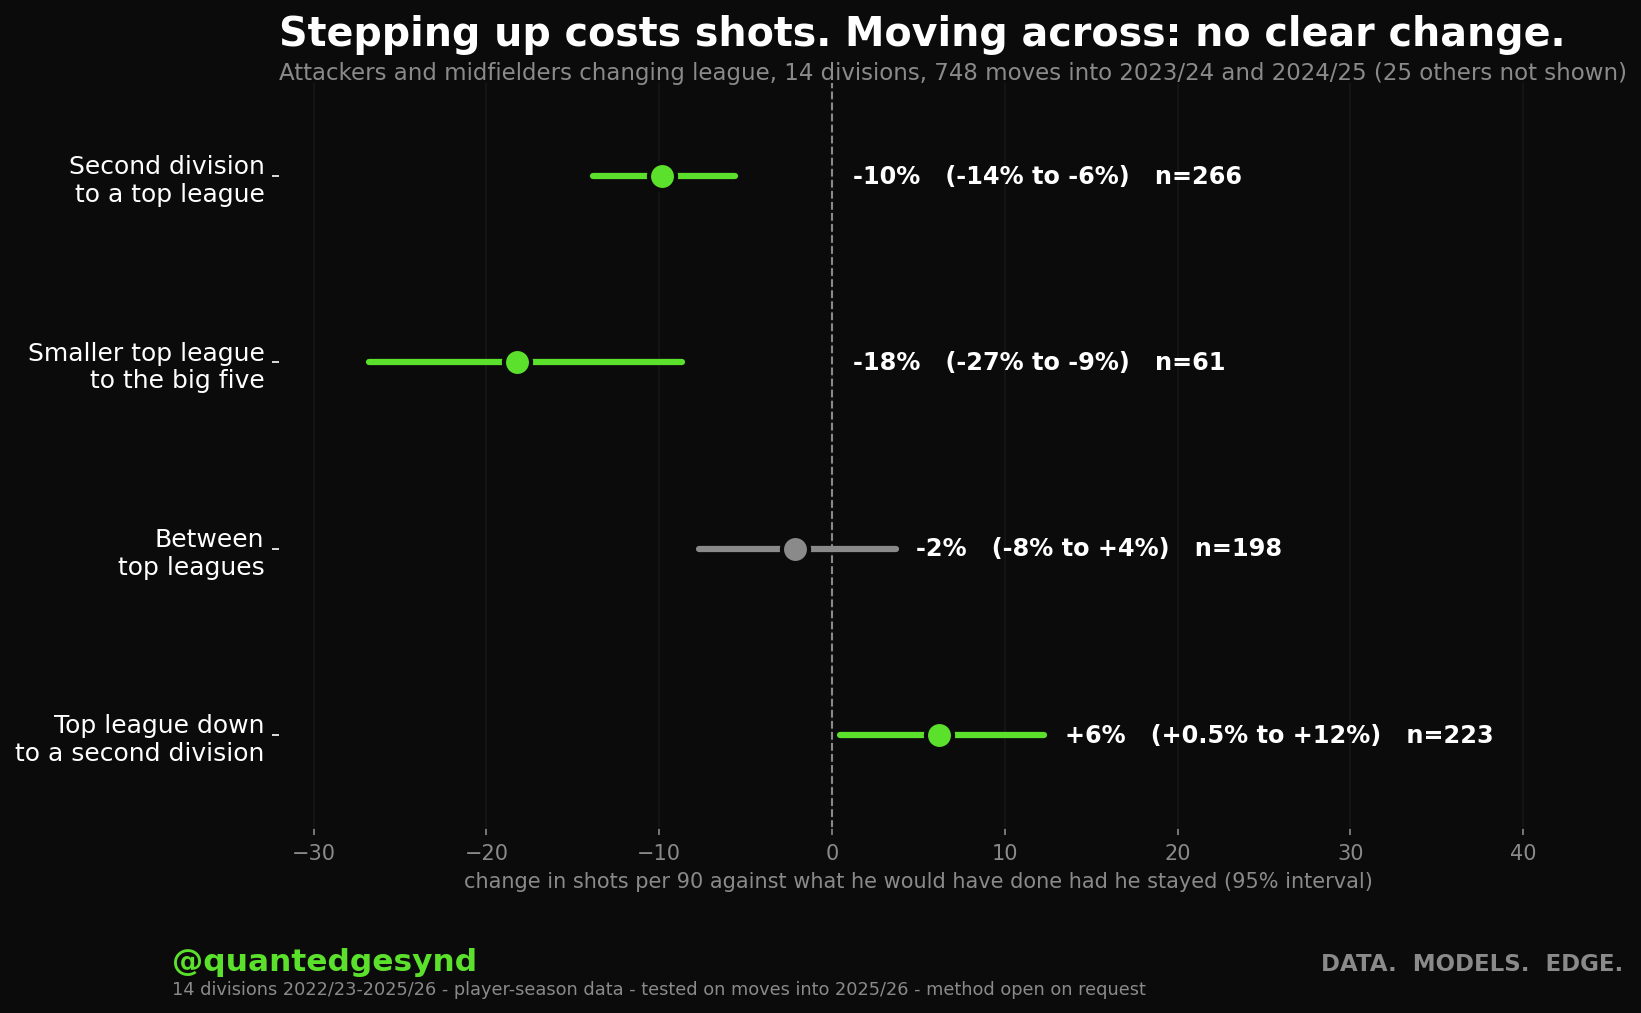
- Second division to a top league: about 10% fewer shots per 90. Somewhere between 6% and 14% fewer, on 266 moves.
- Smaller top league to the big five: about 18% fewer. Between 9% and 27% fewer, on 61 moves. The Eredivisie, Portugal, Belgium and Scotland into England, Spain, Italy, Germany or France.
- Between top leagues: no clear change. The average is 2% fewer, and the range runs from 8% fewer to 4% more. This group also includes moves from the big five down to a smaller top league.
- Down to a second division: a few more. About 6% more, somewhere between 0.5% and 12% more. Small, and only just clear of zero, so treat it as tentative.
- We checked it on 442 moves into 2025/26 that the fit never saw. It held for moves across and down. For stepping up, our ranges were too narrow, so we don't give one.
Shots per 90 minutes in league football. A move is an attacker or midfielder who played a season in one of our 14 divisions and the next season in a different one, loans included. Only players who took five or more shots after the move are in the averages, so this is about players who got a game: 1,262 is every move we found, the averages use the 773 moves into 2023/24 and 2024/25 that clear that bar, and the test uses all 442 moves into 2025/26.
Compared with what?
The obvious check is this season against last season. That mixes two things up: the new league, and the fact that a player coming off a big season usually drops back wherever he plays next.
So we compare each mover with what we'd have expected if he'd stayed in his old league. Whatever gap is left is the move.
| Move | Moves | Shots per 90 | 95% interval |
|---|---|---|---|
| Second division to a top league | 266 | 10% fewer | 6% to 14% fewer |
| Smaller top league to the big five | 61 | 18% fewer | 9% to 27% fewer |
| Between top leagues (incl. big five down to a smaller one) | 198 | 2% fewer | 8% fewer to 4% more |
| Top league down to a second division | 223 | 6% more | 0.5% to 12% more |
The step into the big five from a smaller league is the biggest effect and the least certain one, because there were only 61 such moves in two seasons. The step up from a second division is smaller but much firmer.
Did the ranges hold up?
For each player we also give an 80% range for his shots per 90 after the move. Say 80% and it should happen about 80% of the time. We fitted everything on moves into 2023/24 and 2024/25, then checked it against 442 moves into 2025/26.
| Move | Moves tested | Inside our 80% range | Verdict |
|---|---|---|---|
| Between top leagues | 121 | 100 (83%) | Holds |
| Down to a second division | 112 | 95 (85%) | Holds |
| Smaller top league to the big five | 43 | 36 (84%) | Too few to call |
| Second division to a top league | 149 | 105 (70%) | Fails |
| All moves | 442 | 348 (79%) |
The average for stepping up is solid. The spread around it isn't. Some players step up and shoot more than ever, some disappear, and our range doesn't stretch far enough to cover both. So for that move we give the average and no range.
We need at least 100 tested moves before we call a range reliable, so the step into the big five stays uncalled for now, even though 84% landed inside it.
What this doesn't cover
- Finishing. How a player's conversion changes after a move hasn't been tested, so we don't translate it.
- Shot quality. This is shot volume only. We have shot locations and xG for the big five but not the other nine divisions, so quality stays out of the study.
- Loans and permanent moves together. We now have transfer records that can split them, but this study doesn't yet.
You can see this applied to every Premier League attacker who has since moved in the player explorer.
Data sources
- API-Football: per-season player statistics for league football (minutes, shots, shots on target, goals, assists, key passes, passes, dribbles, duels, tackles, fouls, blocks, interceptions, match rating) and the position label. 14 divisions, 2022/23 to 2025/26.
- API-Football: transfer records, to tell a move from a club going up or down.
Corrected on 25 September 2026. When a player split a season between two clubs, we had dropped the shorter spell if it was under 600 minutes. Counting the whole season adds 13 moves (1,262 in all; 773 in the averages, 442 in the test). The averages barely moved: stepping up is still about 10% fewer shots, the step into the big five 18% fewer (was 19%). The one change of meaning is moving down a division: about 6% more, and the interval now runs from 0.5% to 12% more, so it just clears zero where before it touched it; treat it as tentative. The ranges still hold for moves across and down, 79% overall, and still fail for stepping up (70%). The chart was redrawn.
Want this run on a player you're working on? We'll do the first one free. How it works →