
His injury record. Not his age, and not how much he played.
Corrected on 25 September 2026. Figures updated after a data fix; the conclusions are unchanged. Details at the end.
- Last season's injuries are the signal. Players who missed no league games through injury: 21% missed five or more the next season. Players who missed ten or more: 51%.
- Age barely moves it. From 26% for under-23s to 31% at 27 to 30.
- Heavy league minutes go the wrong way. The most-used players were injured slightly less the next season (25%), probably partly because fit players get picked. We haven't tested that.
- Total workload doesn't predict it either. Cups, Europe and internationals included, on 1,747 player-seasons at clubs playing in Europe.
- A model using all of it scores about 6% better than simply using each league's average rate, on one season it never saw. It did better in all seven leagues, though it ranks players worst in the Eredivisie. Real, but modest.
An injury game is a league fixture a player missed for a medical reason. Suspensions, illness, international duty and "doubtful" are left out. The outcome is five or more league games missed through injury the next season, in the same league. Seven leagues: Premier League, Championship, La Liga, Serie A, Bundesliga, Ligue 1 and Eredivisie, the ones with injury records back to 2022/23. Players with 600+ league minutes.
The pattern
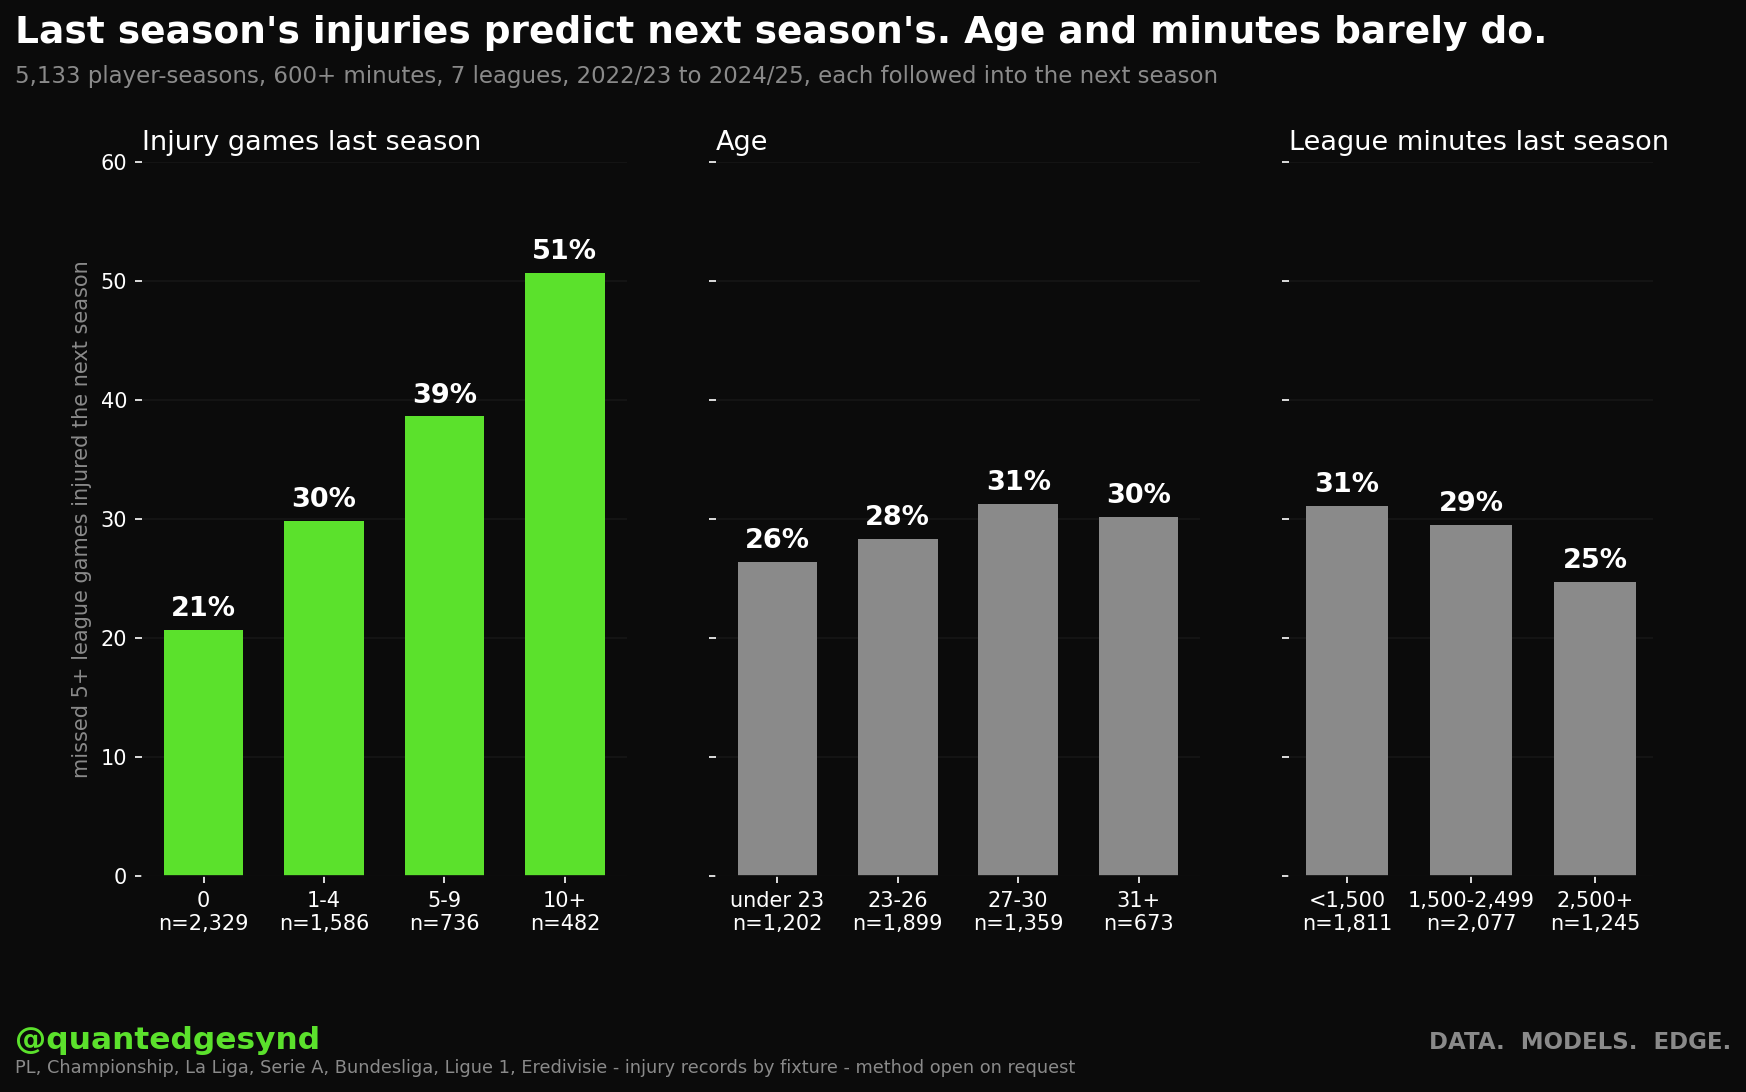
Last season's injury games relate to next season's in every one of the seven leagues, and clearly in each. Age only shows up in the Championship, and weakly there.
What about workload?
League minutes miss a lot of a top player's load. So for players at clubs in Europe we added every minute they played: cups, European games and internationals.
| Total minutes, all competitions | Players | Missed 5+ games injured next season |
|---|---|---|
| Under 2,500 | 192 | 23% |
| 2,500 to 3,500 | 196 | 23% |
| 3,500 to 4,500 | 167 | 20% |
| 4,500 or more | 110 | 18% |
That's only players with no injury games the season before, so a bad record can't hide in the numbers. More minutes, if anything, fewer injuries. On these players, adding workload to the model moved it from 6.0% better than the league average to 6.8%, which is too small to tell from luck.
Bukayo Saka played 4,430, 4,421 and 4,425 minutes in three straight seasons, counting every competition including internationals. In our injury records he then missed 1, 12 and 5 league games through injury. Same load, three different outcomes.
How good is the prediction?
We trained on 2022/23 and 2023/24 and tested on players from 2024/25, followed into 2025/26. Scored on how close its probabilities came to what happened, it was about 6% better than simply using each league's average rate, and between 3.4% and 10.6% better league by league. It's one test season, and at putting players in the right order it was weakest in the Eredivisie.
| Players ranked by predicted risk | We said | Happened |
|---|---|---|
| Lowest fifth | 19% | 19% |
| Second | 21% | 24% |
| Middle | 26% | 23% |
| Fourth | 33% | 37% |
| Highest fifth | 43% | 50% |
It sorts players the right way round, but it underrates the most injury-prone fifth. Half of them missed five or more games, and we said 43%.
What it can't see
- Congestion. Three games in a week is a different load from the same minutes spread out. That needs match-by-match minutes, which we haven't tested yet.
- Coming back from an injury. Same reason.
- Other leagues. The injury records only go back far enough in these seven.
- How leagues record injuries. The base rate runs from 38% in the Championship to 14% in the Eredivisie. Part of that is how absences get logged, and part is season length: five games out of 46 in the Championship is a lower bar than five out of 34 in the Eredivisie.
Data sources
- API-Football: injury records, one row per player per missed fixture with the reason, for the seven leagues above from 2022/23.
- API-Football: player ages, league minutes, and season minutes in every competition, cups, Europe and internationals included.
Corrected on 25 September 2026. When a player split a season between two clubs, we had dropped the shorter spell if it was under 600 minutes. Counting the whole season gives 5,133 player-seasons rather than 5,120. The model is still about 6% better than the league average (6.1%, was 6.2%), by 3.4% to 10.6% league by league; players with ten or more injury games the season before now come out at 51% (was 50%). The workload figures did not change. The chart was redrawn.
Want this run on a player you're working on? We'll do the first one free. How it works →