
A striker scored fifteen last season. How much should that change what you think of him?
We expected this piece to say “less than you think”. It doesn't, and the way we got it wrong is worth writing down.
Corrected on 25 September 2026. Figures updated after a data fix; the conclusions are unchanged. Details at the end.
The trap we walked into
Our first piece found that finishing barely lasts. Split players into good and poor finishers, come back a year later, and nearly all of the difference between them has gone.
That points to an obvious next step, and we took it. If goals are part shooting and part finishing, and finishing is mostly luck, then stop counting goals and count shots. Shots are the clean signal underneath.
It sounds right, but we tested it anyway. Among Premier League attackers, last season's goals predict next season's goals slightly better than shot volume does.
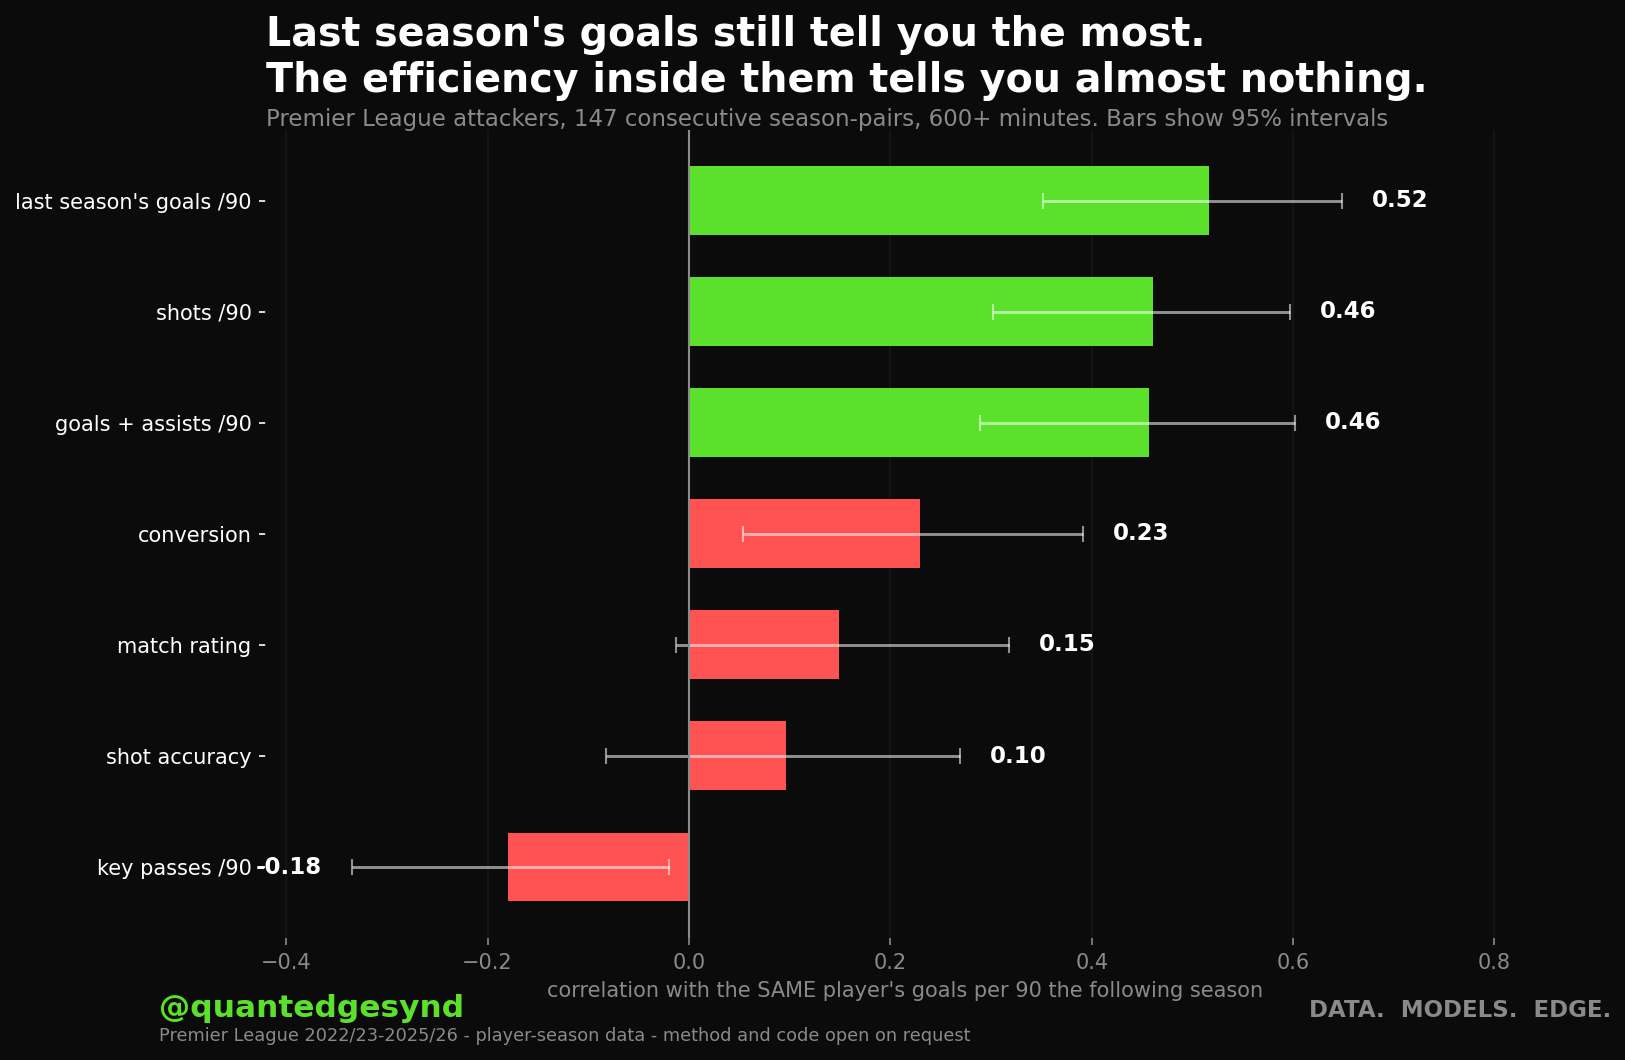
Goals come out at 0.52, shots at 0.46, goals and assists at 0.46. Look at the bars, though: those three overlap almost completely. So it isn't that goals win. All three tell you about the same amount, and none of them is far enough ahead to be worth switching to.
Swapping goals for shots doesn't gain you anything. Where people go wrong is taking the number apart and paying extra for the wrong half of it.
Two questions that sound like one
This took us longest to see, so we'll go slowly.
A class sits an exam. The top half average 80% and the bottom half 50%. A year later the same class sits a much harder paper and everyone's marks drop. Now the top half average 60%, and the bottom half are still on 50%.
The gap between the two groups has shrunk from thirty points to ten. But the same pupils are still the ones at the top.
“Is the gap still there?” and “are the same people still ahead?” are different questions, and a stat can fail the first while passing the second.
Our first piece measured the gap. This one measures the order. A striker's goal rate does fall back hard towards the pack (that's the first piece, and it holds up), but he's still roughly where he was in the queue.
So what should you throw away?
The success rates hiding inside the goals, rather than the goals themselves.
Conversion, the share of his shots on target that went in, scores 0.23 against next season's goals. Shot accuracy scores 0.10, and its interval crosses zero. Put simply, we can't rule out that it tells you nothing at all.
Those two are exactly what a scouting report reaches for when it wants to justify a signing the goal count alone won't support. He's a natural finisher. His shot accuracy is elite. Neither claim survives into the next season.
What it means for a shortlist
Split a striker's season in two.
How often he got a shot away is a habit. It comes from how he plays and what his team asks of him, and it turns up again next year.
How often those shots went in is mostly down to the season he happened to have.
In practice, keep the goal count. It already contains both halves, and it does the job as well as anything else we tested. What you shouldn't do is pull it apart, find the finishing half, and pay a premium for that in particular.
One thing we didn't expect
Among attackers, key passes per 90 score minus 0.18 against next season's goals. Slightly negative, in other words: the players creating chances tend not to be the ones finishing them.
The interval only just clears zero (−0.33 to −0.02), and it's one result among several we tested, so we're still not calling it a finding. It does cause problems for any product that rolls a forward's whole game into one rating, though, because at least two of the ingredients pull in opposite directions.
Limits
147 attacker season-pairs isn't many. The top three stats sit inside each other's intervals, and we've said so rather than ranking them as if the order meant something.
It's one league, four completed seasons and public season totals, with no event or tracking data. And the correlations here are about who ranks where, not how many goals a particular player will score.
Most importantly, 0.52 still leaves the large majority of next season unexplained. Goals are the best of a weak bunch, which isn't the same as good.
Reproduction
Same panel and filters as the persistence piece. Method, code and intervals are available on request, including the tests that went nowhere.
This piece only exists because the first one pointed somewhere that didn't hold up. Catching that is a big part of why we publish.
Data sources
- API-Football: per-season player statistics for league football (minutes, shots, shots on target, goals, assists, key passes, passes, dribbles, duels, tackles, fouls, blocks, interceptions, match rating) and the position label. Premier League, 2022/23 to 2025/26.
Corrected on 22 September 2026. The original counted only one of the data provider's two labels for strikers. With both, the sample is 145 season-pairs rather than 130 and the figures move slightly (goals 0.53 to 0.52). One sentence changed meaning: the key-passes interval now just clears zero, and the text above says so. The chart was redrawn.
Corrected on 25 September 2026. When a player split a season between two clubs, we had dropped the shorter spell if it was under 600 minutes. Counting the whole season gives 147 season-pairs rather than 145. Goals stay at 0.52; goals and assists and shots move from 0.47 to 0.46; conversion 0.22 to 0.23; key passes minus 0.17 to minus 0.18, and its interval still only just clears zero. The conclusions are unchanged and the chart was redrawn.
Want to know what your own metrics score? We'll run this on your data and send you the table. How the audit works →