
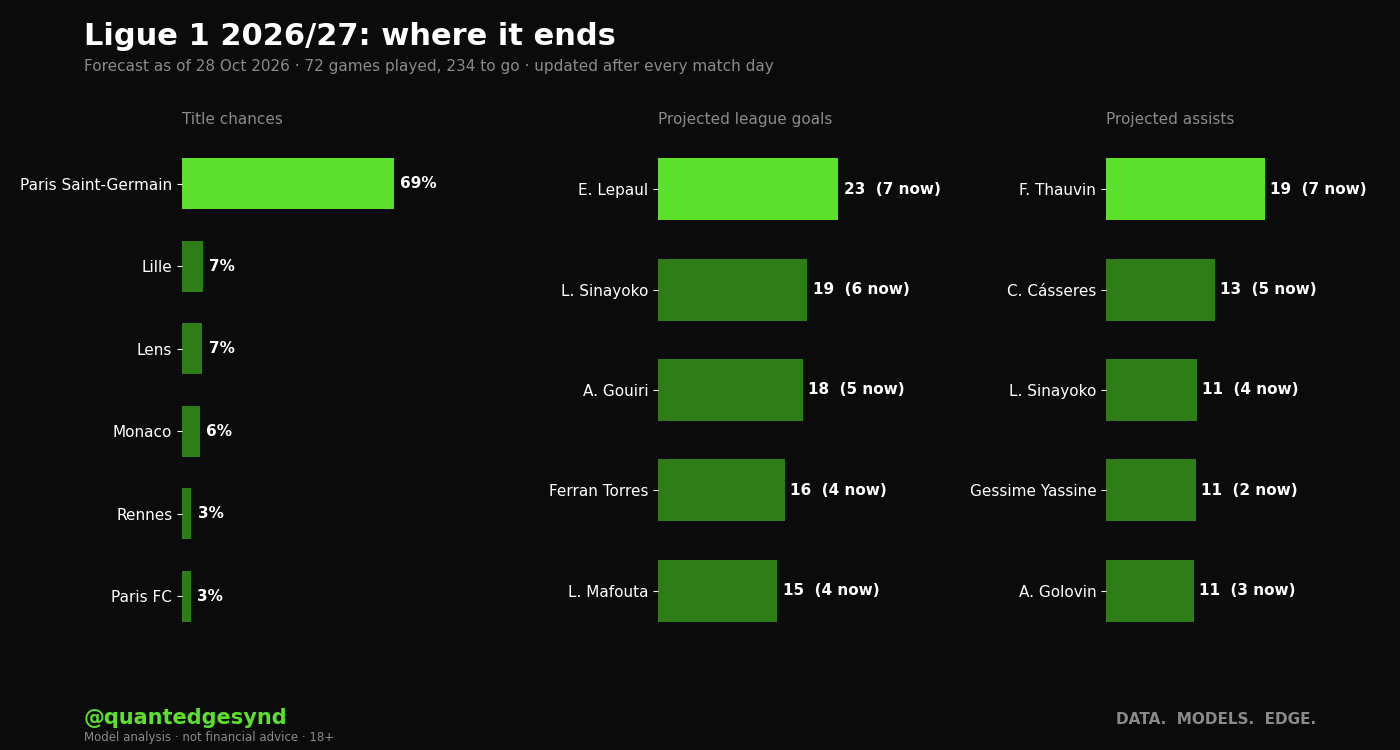
Paris Saint-Germain are 69% to win Ligue 1, with Lille next on 7%. 72 games played, 234 to go. Re-run after every match day.
- Top scorer. E. Lepaul (Rennes) has 7 and projects to about 23. He finishes top in 40% of our simulated seasons.
- Most assists. F. Thauvin (Lens) has 7, projected about 19.
- Going down. Most likely: Angers (69%), Le Havre (38%).
Against the market. Before the season the betting market had Paris Saint-Germain around 89% for the title. We are well below that.
Ratings over the table. Our relegation numbers lean on ratings more than the table: Angers are 69% to go down on 8 points, with 4 clubs below them on fewer.
The projected table
Clubs in order of average finishing position across 10,000 simulated seasons, which is not always the order of projected points. Relegated means the automatic places. 16th goes into a play-off, not counted here. Likely finish is the range a club ends in at least eight seasons out of ten.
| Club | Played | Points now | Projected points | Likely finish (8 in 10) | Title | Top 4 | Relegated |
|---|---|---|---|---|---|---|---|
| Paris Saint-Germain | 8 | 17 | 67 | 1st to 3rd | 69% | 95% | - |
| Lille | 8 | 15 | 55 | 2nd to 10th | 7% | 52% | <1% |
| Lens | 8 | 13 | 55 | 2nd to 10th | 7% | 49% | <1% |
| Monaco | 8 | 15 | 55 | 2nd to 10th | 6% | 48% | <1% |
| Rennes | 8 | 16 | 53 | 2nd to 12th | 3% | 34% | <1% |
| Paris FC | 8 | 14 | 52 | 2nd to 12th | 3% | 33% | 1% |
| Lyon | 8 | 14 | 52 | 2nd to 12th | 3% | 30% | 1% |
| Marseille | 8 | 12 | 50 | 3rd to 14th | 1% | 21% | 1% |
| Toulouse | 8 | 10 | 47 | 4th to 15th | 1% | 12% | 3% |
| Brest | 8 | 9 | 45 | 5th to 16th | <1% | 8% | 6% |
| Lorient | 8 | 12 | 44 | 6th to 16th | <1% | 6% | 7% |
| Le Mans | 8 | 7 | 43 | 7th to 17th | <1% | 4% | 11% |
| Strasbourg | 8 | 7 | 43 | 7th to 17th | <1% | 3% | 11% |
| Auxerre | 8 | 10 | 42 | 7th to 17th | <1% | 2% | 14% |
| Nice | 8 | 11 | 42 | 7th to 17th | <1% | 2% | 15% |
| Troyes | 8 | 5 | 40 | 8th to 17th | <1% | 1% | 22% |
| Le Havre | 8 | 2 | 37 | 10th to 18th | <1% | 1% | 38% |
| Angers | 8 | 8 | 32 | 14th to 18th | - | <1% | 69% |
Every position
Each club's chance of finishing in each place. Brighter means more likely. Blank means it did not happen once in 10,000 simulated seasons, which is not the same as impossible. <1% means under half a percent.
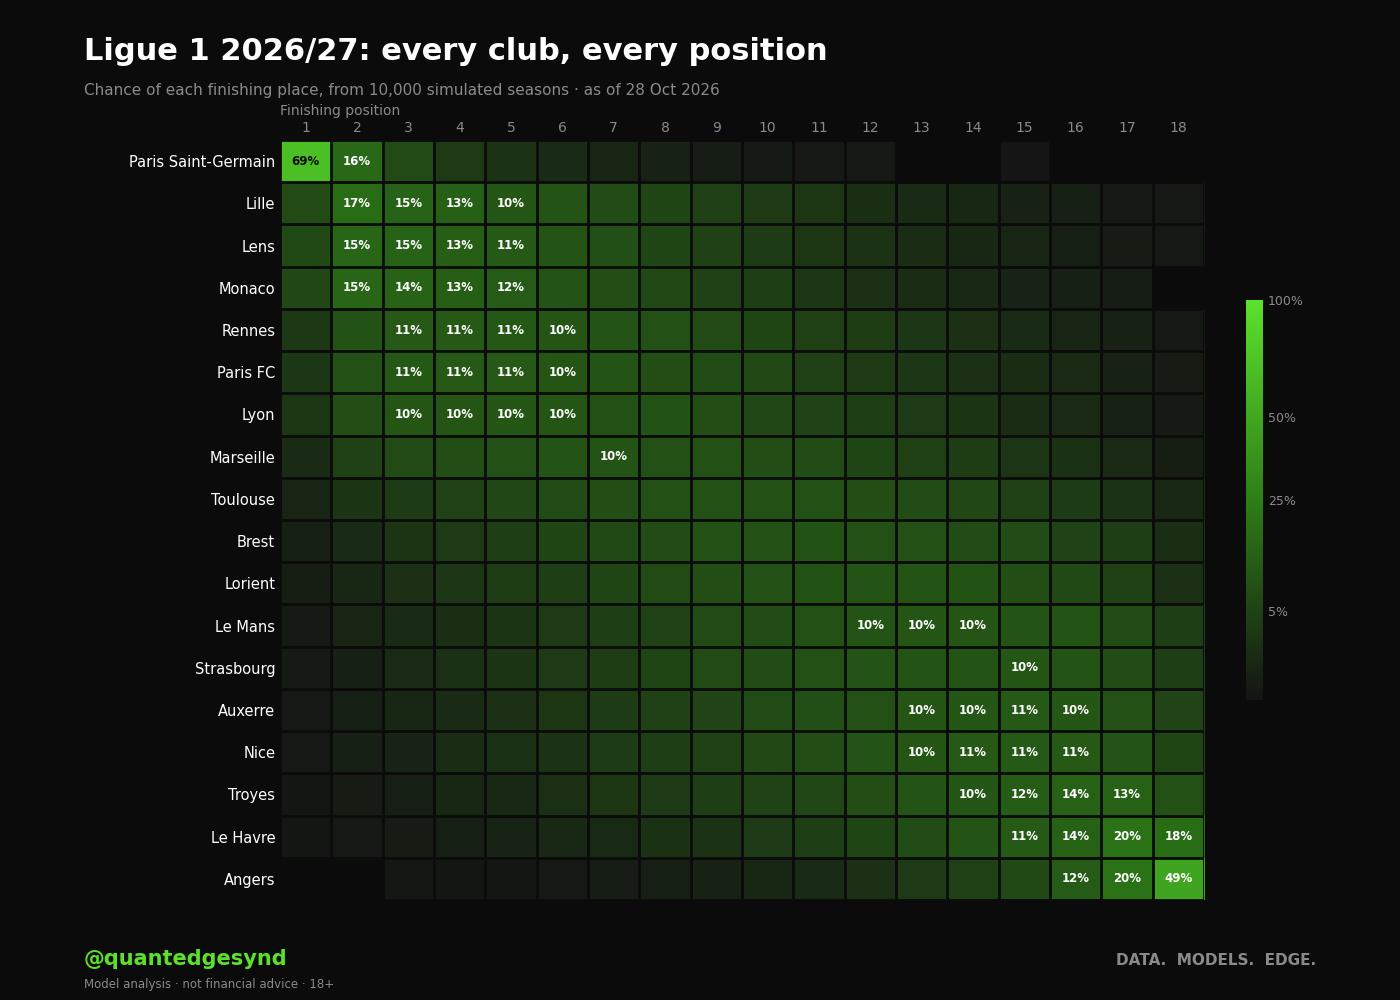
The numbers behind the chart, every club and every place
| Club | 1 | 2 | 3 | 4 | 5 | 6 | 7 | 8 | 9 | 10 | 11 | 12 | 13 | 14 | 15 | 16 | 17 | 18 |
|---|---|---|---|---|---|---|---|---|---|---|---|---|---|---|---|---|---|---|
| Paris Saint-Germain | 69% | 16% | 7% | 3% | 2% | 1% | 1% | <1% | <1% | <1% | <1% | <1% | <1% | |||||
| Lille | 7% | 17% | 15% | 13% | 10% | 9% | 7% | 6% | 5% | 3% | 3% | 2% | 1% | 1% | 1% | <1% | <1% | <1% |
| Lens | 7% | 15% | 15% | 13% | 11% | 9% | 8% | 6% | 5% | 4% | 3% | 2% | 1% | 1% | 1% | <1% | <1% | <1% |
| Monaco | 6% | 15% | 14% | 13% | 12% | 9% | 8% | 6% | 5% | 4% | 3% | 2% | 1% | 1% | 1% | <1% | <1% | |
| Rennes | 3% | 9% | 11% | 11% | 11% | 10% | 9% | 8% | 7% | 6% | 4% | 4% | 3% | 2% | 1% | 1% | <1% | <1% |
| Paris FC | 3% | 9% | 11% | 11% | 11% | 10% | 9% | 8% | 7% | 6% | 5% | 3% | 3% | 2% | 1% | 1% | <1% | <1% |
| Lyon | 3% | 8% | 10% | 10% | 10% | 10% | 9% | 9% | 8% | 6% | 5% | 4% | 3% | 2% | 2% | 1% | 1% | <1% |
| Marseille | 1% | 5% | 7% | 8% | 9% | 9% | 10% | 9% | 8% | 8% | 7% | 6% | 4% | 4% | 3% | 2% | 1% | <1% |
| Toulouse | 1% | 2% | 4% | 5% | 6% | 7% | 8% | 9% | 9% | 8% | 9% | 8% | 7% | 6% | 5% | 4% | 2% | 1% |
| Brest | <1% | 1% | 2% | 3% | 4% | 6% | 6% | 7% | 8% | 9% | 9% | 9% | 8% | 7% | 7% | 5% | 4% | 2% |
| Lorient | <1% | 1% | 2% | 3% | 4% | 4% | 6% | 7% | 8% | 8% | 9% | 9% | 9% | 9% | 8% | 7% | 5% | 2% |
| Le Mans | <1% | 1% | 1% | 2% | 2% | 3% | 4% | 5% | 7% | 7% | 8% | 10% | 10% | 10% | 9% | 9% | 7% | 4% |
| Strasbourg | <1% | <1% | 1% | 2% | 2% | 3% | 4% | 6% | 7% | 7% | 8% | 9% | 9% | 9% | 10% | 9% | 7% | 4% |
| Auxerre | <1% | <1% | 1% | 1% | 2% | 3% | 4% | 5% | 5% | 7% | 8% | 9% | 10% | 10% | 11% | 10% | 9% | 5% |
| Nice | <1% | <1% | 1% | 1% | 2% | 2% | 4% | 4% | 5% | 6% | 8% | 9% | 10% | 11% | 11% | 11% | 9% | 6% |
| Troyes | <1% | <1% | <1% | 1% | 1% | 2% | 3% | 3% | 4% | 5% | 6% | 8% | 9% | 10% | 12% | 14% | 13% | 9% |
| Le Havre | <1% | <1% | <1% | <1% | 1% | 1% | 1% | 2% | 2% | 3% | 4% | 6% | 7% | 9% | 11% | 14% | 20% | 18% |
| Angers | <1% | <1% | <1% | <1% | <1% | <1% | 1% | 1% | 1% | 2% | 3% | 5% | 7% | 12% | 20% | 49% |
Top scorers
League goals only. The range is where he ends up in eight seasons out of ten.
| Player | Club | Goals now | Projected | Range (8 in 10) | Finishes top |
|---|---|---|---|---|---|
| E. Lepaul | Rennes | 7 | 23 | 15 to 31 | 40% |
| L. Sinayoko | Paris FC | 6 | 19 | 12 to 26 | 17% |
| A. Gouiri | Marseille | 5 | 18 | 12 to 26 | 15% |
| Ferran Torres | Paris Saint-Germain | 4 | 16 | 10 to 23 | 7% |
| L. Mafouta | Le Mans | 4 | 15 | 9 to 22 | 6% |
| F. Thauvin | Lens | 4 | 15 | 9 to 21 | 4% |
| C. Archer | Auxerre | 5 | 14 | 9 to 21 | 4% |
| C. Tengstedt | Toulouse | 5 | 13 | 8 to 18 | 1% |
| K. Doumbia | Brest | 4 | 12 | 7 to 18 | 1% |
| P. Brunner | Monaco | 4 | 12 | 7 to 17 | 1% |
Most assists
| Player | Club | Assists now | Projected | Range (8 in 10) | Finishes top |
|---|---|---|---|---|---|
| F. Thauvin | Lens | 7 | 19 | 13 to 26 | 60% |
| C. Cásseres | Toulouse | 5 | 13 | 8 to 19 | 12% |
| L. Sinayoko | Paris FC | 4 | 11 | 6 to 16 | 5% |
| Gessime Yassine | Strasbourg | 2 | 11 | 5 to 17 | 7% |
| A. Golovin | Monaco | 3 | 11 | 6 to 16 | 5% |
| Emerson | Marseille | 3 | 9 | 5 to 13 | 2% |
| Z. Athekame | Lyon | 3 | 8 | 4 to 12 | 1% |
| A. Thomasson | Rennes | 2 | 8 | 4 to 12 | 1% |
| P. Šulc | Lyon | 3 | 8 | 4 to 11 | 1% |
| A. Gouiri | Marseille | 2 | 7 | 3 to 12 | 1% |
How it works
Every league game left is played out 10,000 times. Team strengths come from our match ratings, built from this season's and last season's results. Points settle the table, then goal difference and goals scored. La Liga and Serie A break ties on head-to-head first, which we don't model.
A player's total is his goals or assists so far, plus his rate this season blended with last season's, times the share of minutes he is getting, times the games his team has left. When his team scores more in a simulated season, so does he.
What it can't see
Injuries still to come, January signings, manager changes and points deductions. Ratings don't allow for us being wrong about a team, so the biggest numbers run too high and the ranges too narrow. Our own test of league forecasts in English football found betting prices read a final table better than results-based ratings do, and that results-based ranges come out too narrow. This forecast uses results-based ratings, so treat the biggest numbers with care. It is not scored yet: we keep every update and will score them all when the season ends. How we scored our league forecasts before.
The other forecasts
Premier League forecast · La Liga forecast · Serie A forecast · Bundesliga forecast · Champions League forecast · Ballon d'Or 2027 · Injury risk